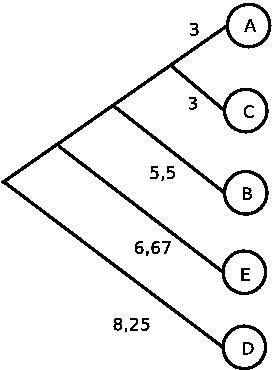
| Given a distance matrix Problem A: Construct a phylogenetic tree using UPGMA Problem B: Construct the tree using Fitch-Margoliash. Why is the result different? |
|
| Solution A: Note that the image could look different, as there were a couple of places where you had to pick randomly between two possible options that had the same distance. |
|
|
Solution B:
In this image, all distances are simply distances between nodes or
branches. They are not relative to the root as in the first exercise,
since this tree has none.
The image is different from the first one in that it has different branch lengths. This is because the original matrix did not satisfy the ultrametric property (rate of evolution is not constant). The tree constructed by Fitch-Margoliash also has no root. | 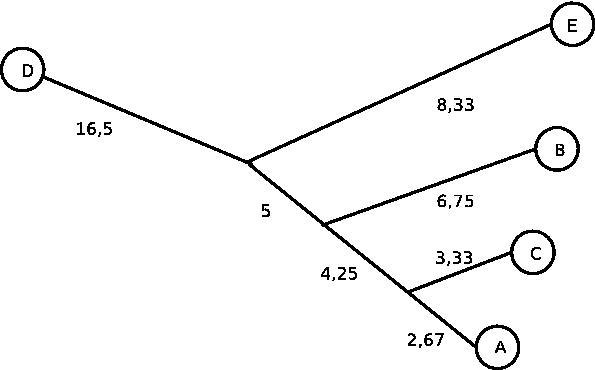
|
| Problem 1: Show hair pins, loops, and stems of the structure in picture. There is a definition of K-loop decomposition in my report. What conditions must k fill if the loop is a) hairpin loop? b) a multiple loop? | 
|
|
Solution 1: a) For a hairpin loop k=1. b) For a multiple loop k>2. | 
|
For example the following CFG:

S->gSu	    S->aS	  S->a
S->uSg	    S->uS	  S->u
S->aSu	    S->gS	  S->g
S->uSa	    S->cS	  S->c
S->cSg
S->gSc


S ->
gSu ->
gaSuu ->
gauSauu ->
gauSSauu ->
gauuSSaauu ->
gauuuaSSauu ->
gauuuagScSauu ->
gauuuagcSgcSauu ->
gauuuagcuSagcSauu ->
gauuuagcucSgagcSauu ->
gauuuagcucaSgagcSauu ->
gauuuagcucagSgagcSauu ->
gauuuagcucagddSgagcSauu ->
gauuuagcucagddgSgagcSauu ->
gauuuagcucagddggSgagcSauu ->
gauuuagcucagddgggSgagcSauu ->
gauuuagcucagddgggagagcSSauu ->
gauuuagcucagddgggagagcgSSauu ->
gauuuagcucagddgggagagcgcSSauu ->
gauuuagcucagddgggagagcgccSSauu ->
gauuuagcucagddgggagagcgccaSSauu ->
gauuuagcucagddgggagagcgccagSSauu ->
gauuuagcucagddgggagagcgccagaSSauu ->
gauuuagcucagddgggagagcgccagacSSauu ->
gauuuagcucagddgggagagcgccagacuSSauu ->
gauuuagcucagddgggagagcgccagacugSSauu ->
gauuuagcucagddgggagagcgccagacugaSSauu ->
gauuuagcucagddgggagagcgccagacugaaSSauu ->
gauuuagcucagddgggagagcgccagacugaaaSSauu ->
gauuuagcucagddgggagagcgccagacugaaapSSauu ->
gauuuagcucagddgggagagcgccagacugaaapcSgaauu ->
gauuuagcucagddgggagagcgccagacugaaapcuSagaauu ->
gauuuagcucagddgggagagcgccagacugaaapcugScagaauu ->
gauuuagcucagddgggagagcgccagacugaaapcuggScagaauu ->
gauuuagcucagddgggagagcgccagacugaaapcuggaScagaauu ->
gauuuagcucagddgggagagcgccagacugaaapcuggagScagaauu ->
gauuuagcucagddgggagagcgccagacugaaapcuggagcScagaauu ->
gauuuagcucagddgggagagcgccagacugaaapcuggagcccagaauu ->
gauuuagcucagddgggagagcgccagacugaaapcuggagccacagaauu
Problem 2: In my report and also in the presentation I gave the algorithm for finding all even length maximal palindromes. Give the definition for odd length maximal palindromes and the details of an algorithm for finding all odd length maximal palindromes. You do not have to present the details of finding the length of longest common extensions.
Solution 1:
a)
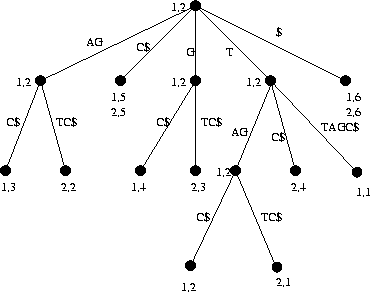
b) The markings are indicated in the picture. All common substrings which are at least two characters long can be found by looking at the nodes that are marked with both 1 and 2. If the string-depth of these nodes is greater than or equal to 2, the path-label of the node is a common substring of the two sequences. There are two such nodes in the tree. The path-labels of these nodes are 'AG' and 'TAG'. Of course also substrings of these path-labels are substrings of both of the original sequences so 'TA' can also be added to the answer. The algorithm given does not actually do this so answers with or without 'TA' where accepted.
Solution 2:
Basically an odd length palindrome is just like an even length
palindrome. There is just one character between the two halves of
the palindrome. So an odd length maximal palindrome centered at q
with radius k is a substring of the original sequence such that the
characters at positions q+i and q-i are equal for all i less than
or equal to k and the characters at positions q+k+1 and q-k-1 are
different.
Note that there is a difference between maximal and maximum
palindromes. A maximal palindrome is a palindrome that cannot be
extended. A maximum palindrome would be the longest palindrome in
the whole sequence.
In principle every substring of length 1 is an odd length
palindrome. In practice we hardly want to list these.
The algorithm for finding all maximal odd length palindromes is as
follows. First the given sequence is reversed. Then the sequence
and its reverse are preprocessed for the longest common extension
queries. Then longest common extension queries are done for each
pair (q+1, n-q+2). If the query returns a value other than zero, a
maximal odd length palindrome centered at q has been found. The
length of the palindrome is 2*k+1 where k is the return value of
the longest common extension query.
Problem 2: Repeat the exercise for the best local alignment using S-W.
Solution 1:

            H    E    A    T    W    A    V    E

      0  - -2 - -4 - -6 - -8 --10 --12 --14 --16
      |  \    \    \    \    \    \    \    \
 F   -2    -1 - -3 - -5 - -7 - -9 --11 --13 --15
      |  \  | \                             \
 E   -4    -3    0 - -2 - -4 - -6 - -8 --10 --12
      |  \  |    | \              \
 A   -6    -5   -2    1 - -1 - -3 - -5 - -7 - -9
      |  \  |    |    | \
 T   -8    -7   -4   -1    2 -  0 - -2 - -4 - -6
      |  \       |    |    | \    \    \    \
 H  -10    -7   -6   -3    0    1 - -1 - -3 - -5
      |     | \       |    | \  | \    \    \
 E  -12    -9   -6   -5   -2   -1    0 - -2   -2
      |     |    | \  |    | \  | \  | \    \
 R  -14   -11   -8   -7   -4   -3   -2   -1 - -3


  F E A T H E R -
  H E A T W A V E

  F E A T H E - R
  H E A T W A V E

  F E A T H - E R
  H E A T W A V E

  F E A T - H E R
  H E A T W A V E
"It is sufficient to give any of the four above alignments as the answer, as
the task was to find 'the best alignment', i.e. an alignment with the best
score, not all of them."
Solution 2:

            H    E    A    T    W    A    V    E

      0     0    0    0    0    0    0    0    0

 F    0     0    0    0    0    0    0    0    0
              \                             \
 E    0     0    1    0    0    0    0    0    1
                   \              \
 A    0     0    0    2 -  0    0    1    0    0
                      | \              \
 T    0     0    0    0    3 -  1    0    0    0
         \                 | \    \
 H    0     1    0    0    1    2 -  0    0    0
              \              \  | \         \
 E    0     0    2 -  0    0    0    1    0    1
                 | \                   \
 R    0     0    0    1    0    0    0    0    0


  EAT
  EAT
Problem 2: Which do you think is better for finding clusters in gene expression data, k-means or SOM? Why?
Solution 1:
It can be caused at least by the following factors:
- manufacturing deficiencies such as scratches on the chip
- failures in the microarray experiment, for example,
the temperature might be too high or too low
- probes within the same probe set might be related
to alternatively spliced versions of the mRNA species (*)
- individual variance in the gene sequence
- the concentration of an mRNA species doesn't necessarily
correlate with the activity of the corresponding protein
- sequence specific differences in binding affinity (*)
Notice: the factors marked by (*) are related to oligonucleotide
microarrays only, while the other factors are related to
all microarrays (including oligonucleotide microarrays).
Solution 2: Usually SOM, but in some cases k-means clustering.
When using SOM, the upper bound of the number of clusters must be defined, while when using k-means clustering, the exact number of clusters must be known beforehand. This makes k-means a poor choice. Usually little is known about the gene expression profile of the sample, so SOM should be used for clustering.
However, if the number of clusters can be guessed with reasonable
accuracy (based on earlier experiments, for example) and the
response time is an issue, then k-means could also be used,
because k-means usually converges faster than SOM.
Problem 2: Discuss in a brief essay the reasons for which HMMs are more descriptive of sequence similarity than the simple Markov chain of follow-up frequencies you just built. What are the problems in analyzing the similarity of the given sequences with a basic HMM?
Additional information:
Type your answer on a single A4-sheet by computer; print a two-sided version
if your essay gets overlength. All answers should easily fit on one side
just as well.
As background information, the first sequence is a human gene SLC2A5; the
latter two are the nucleotide homologues reported for it by GeneLynx (http://
www.genelynx.org/): the second sequence is AF161071 (Mus musculus) and
the third is D28562 (Rattus norvegicus).
Hence some similarity could be expected to rise from an appropriate model.
Solution 1:
For each pair of symbols, count the number of times it appears in the
sequence that is being modeled. From the appearance counts for
all pairs {aa, ac, ag, at, ca, cc, cg, ct, ga, gc, gg, gt, ta, tc, tg,
tt}, count the number of pairs that start with a given symbol, i.e., pairs
that have "a" first, "c" first and so on. Now the count of "ac"
appearances divided by the number of pairs starting with "a" can be used
to define the transition probability from state "a" to state "c" etc.
The symbol "n" in sequence 2 was a wildcard and it can be interpreted such
that any nucleotide could appear there with equal probability; in this
case, one may just skip it, or count 1/4 appearance for each symbol, for
example. Using a zero probability for wildcard will make your Markov chain
fundamentally more useless than it already is.
Having thus derived a transition matrix T, you should observe that the
distribution is near uniform: from any given symbol, it is almost as
likely to move to any of the symbols. The "at"-probability is the smallest
(0.11) and the "gt"-probability largest (0.36); all the other
probabilities lie between 0.21 and 0.33. The decimals in your matrix will
likely depend a little on your choice of programming tool.
Then, using the matrix T, multiplying the probabilities of each transition
that would be used in individually generating the two sequences that are
being compared to the model sequence, one obtains "dummy likelihoods" for
the sequences. From the fact that the probabilities are all near 1/4, it
is expected that the likelihood of any sequence of length more than a few
positions will rapidly go to zero.
For short chains and highly nonuniform distributions (e.g., after "a", we
almost always see "c"), we might actually be able to get some sense out of
the results, but with these sequences and this probability matrix, which
are unfortunately rather typical bioinformatics examples, interpreting the
result is useless.
This is easily noticed by calculating for example the likelihood of the
model sequence itself or the likelihood of any sequence of a certain
length, or the maximum likelihood (i.e. always take the "best" transition)
for a fixed-length sequence), and comparing the infinitesimal likelihoods
of the comparison sequences to these, also infinitesimal figures.
In general, all of the answers could have been improved with just a couple
of sentences of explanation on why the results are as they are, and
whether the outcome could be drastically different for a different
_practical_ dataset.
Solution 2:
Basic HMMs capture the idea that some positions of the sequence may have a
different probability to emit some a certain symbol than other positions,
whereas the above model is indifferent to the position of the emitted
symbol. The immediate history of the sequence can be taken into
account using the Markov property; if a longer history is needed, the
order of the transition chain should be increased - this property,
however, applies in some sense also to the above model: the above model
can use information on the previously emitted symbol, whereas in HMM we
can use information of the position of emission, but the transitions are
in a sense independent from the emissions.
Basic-HMMs would have trouble with the above dataset, as they handle
sequences of the same length; a profile-model HMM with insertions and
deletions would be necessary to study the similarities of the three given
sequences. Building one would not be exactly straightforward; for example,
a priori of some kind for what symbols are exchangeable and to what extent
is necessary - using just one chain to estimate the HMM parameters without
using any priors will just build an HMM that always emits exactly that
sequence, and hence is of little use. More samples would be needed.